Interdisciplinary research lab in data visualization and HCI at the University of Edinburgh.
People - Jobs+PhD Projects
Equipment (kit) - Resources
Teaching - Outreach
Projects/Tools - Student Projects
https://vishub.net
Follow @vishublab


Visualization Tools
Tools, in the form of editors with graphical user interface or as coding libraries, are indepensable for leveraging the full power of data visualization.
We build novel tools, often with interaction and openly available on the web. We create tools for specific data types (e.g., networks) and want to understand why certain tools are more successful and usable than others. How can we make them more useful? What problems do people encounter when trying to learn and use these tools?
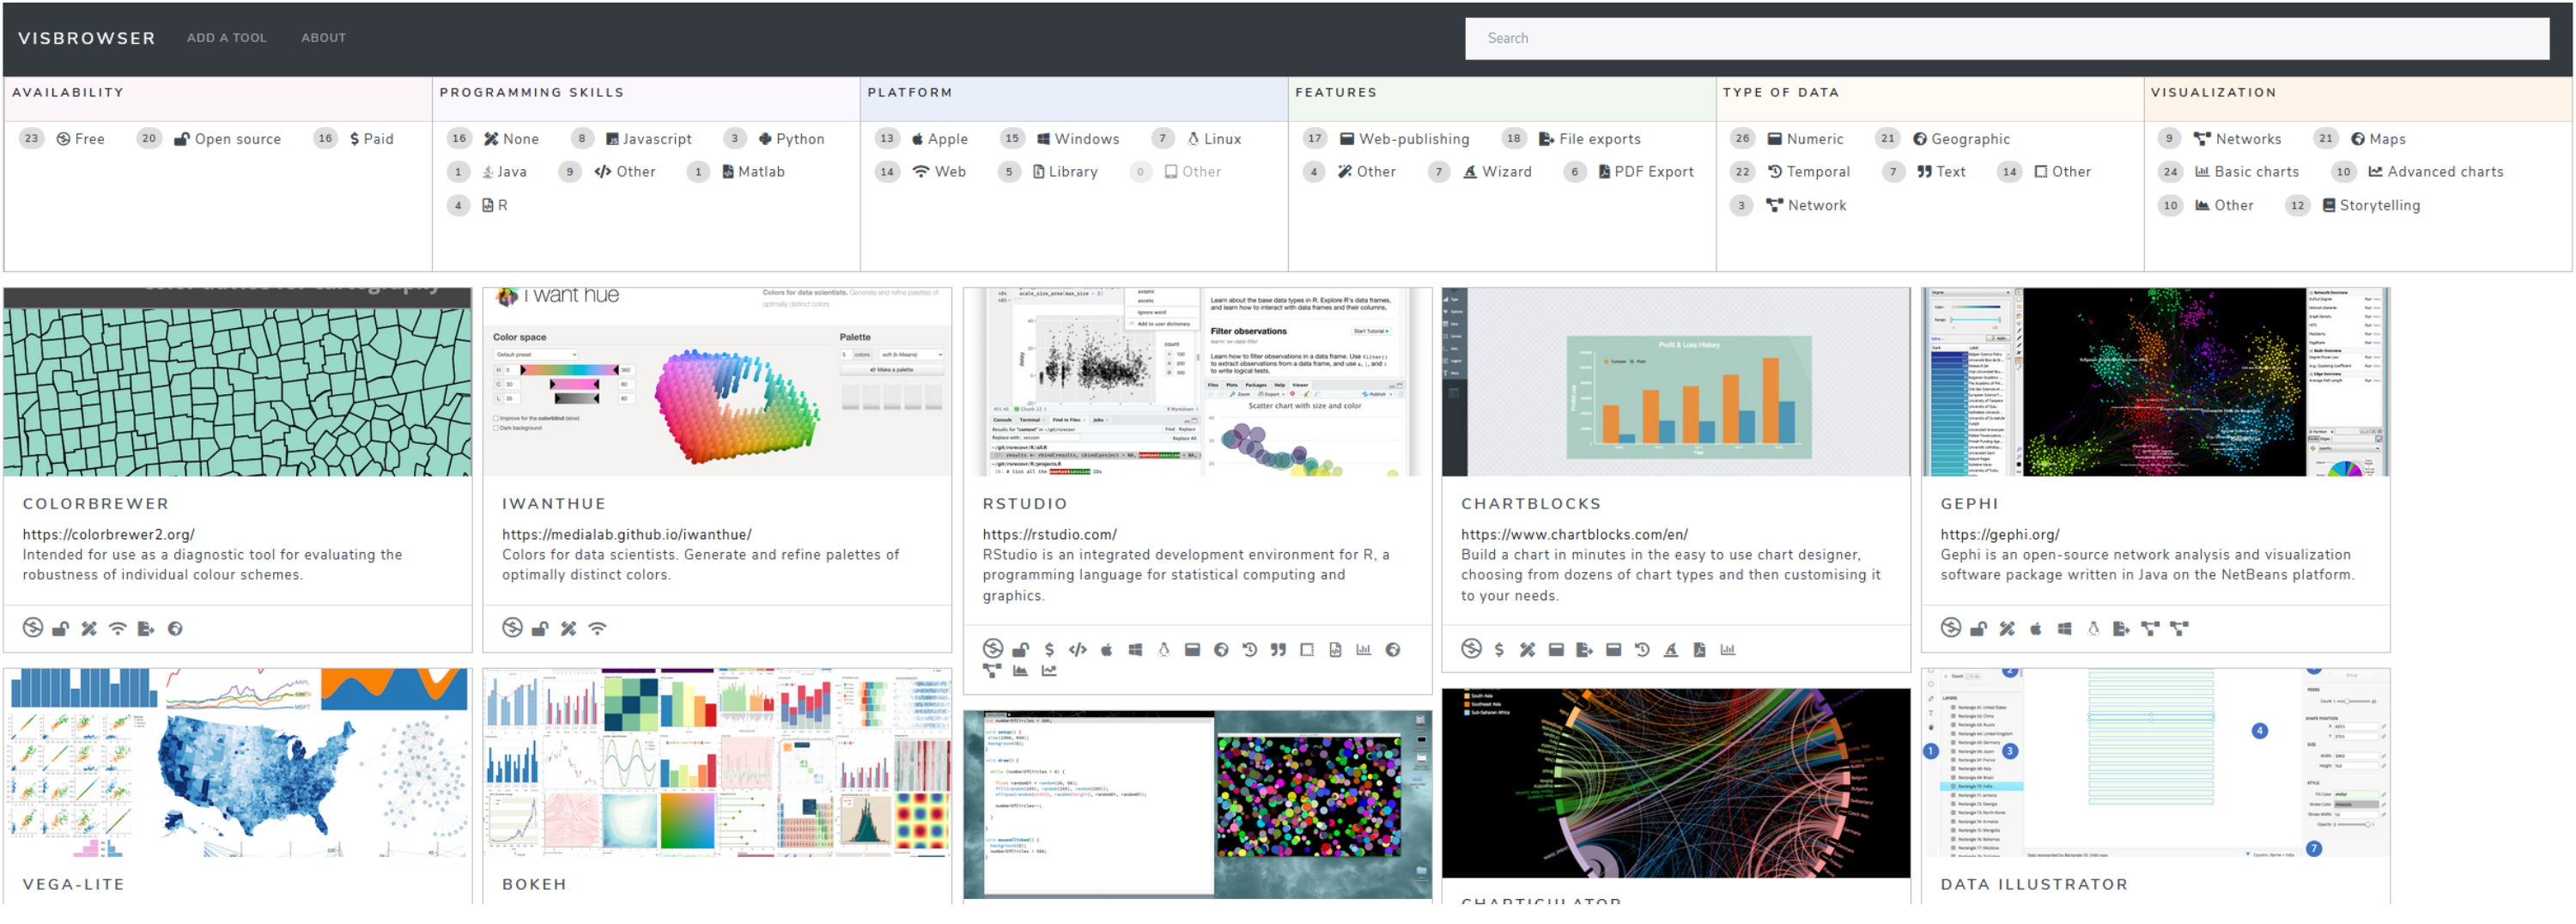
We also collect tools from many authors on our VisTools browser.
People involved
- Benjamin Bach (Google Scholar)
- Arran Ridley
- Zezhong Wang
Publications

The VisTools Marketplace: An Activity to Understand the Landscape of Visualisation Tools: Arran Ridley, Sarah Schöttler, Aba-Sah Dadzie, Benjamin Bach. Workshop on Vis Activities @ IEEE VIS conference. (2020). [WEB]
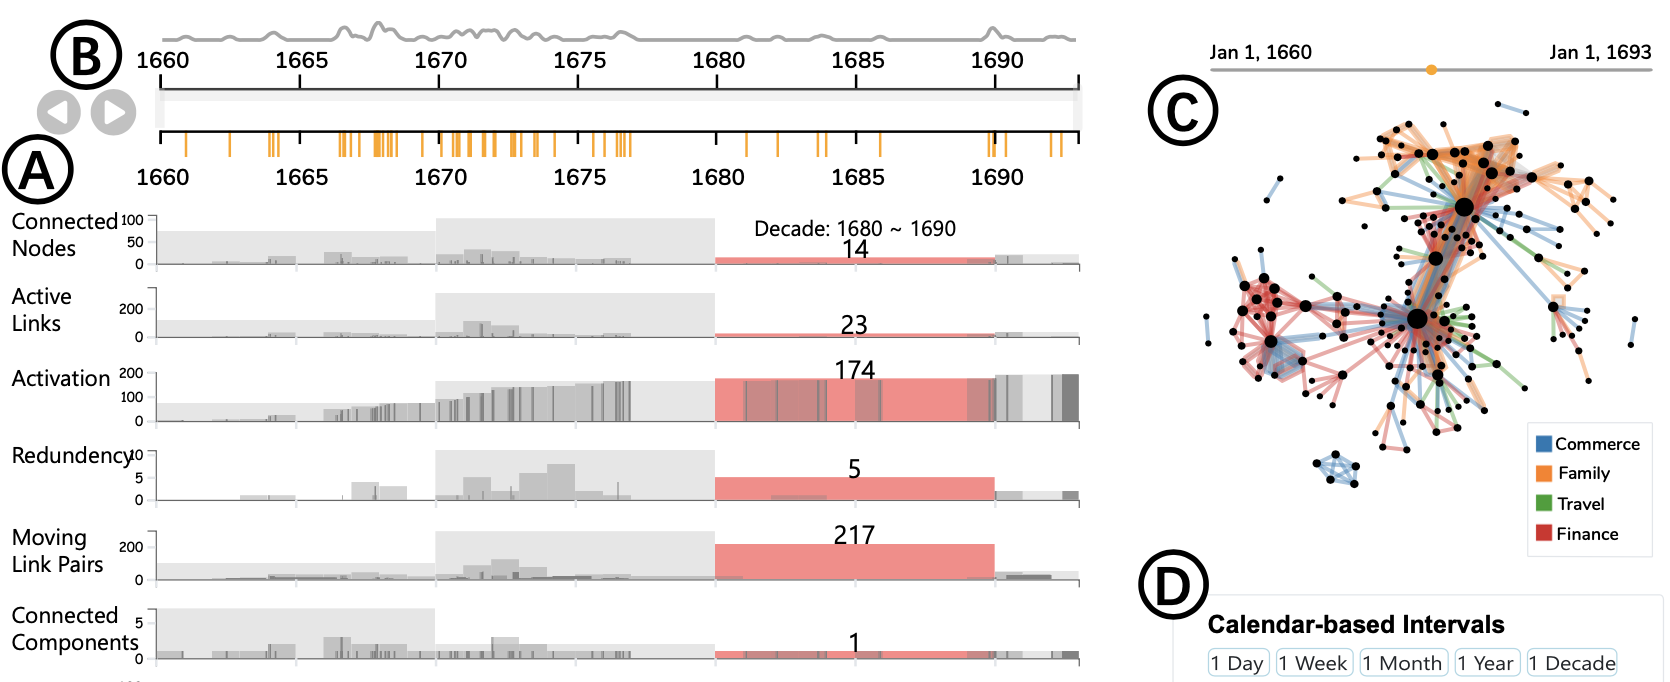
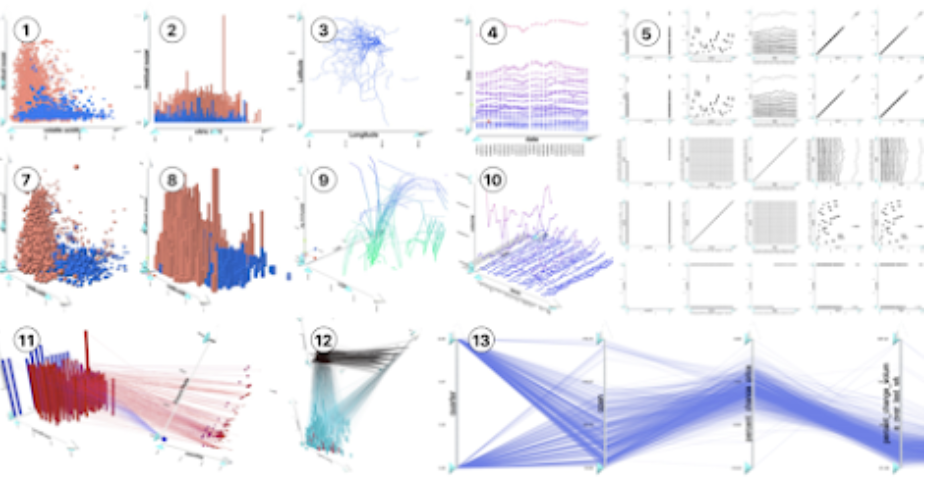
Interactive Time-Series of Measures for Exploring Dynamic Networks: Liwenhan Xie, James O'Donnel, Benjamin Bach, Jean-Daniel Fekete. International Confernce on Advances Interfaces (AVI). (2020). BEST PAPER HONORABLE MENTION
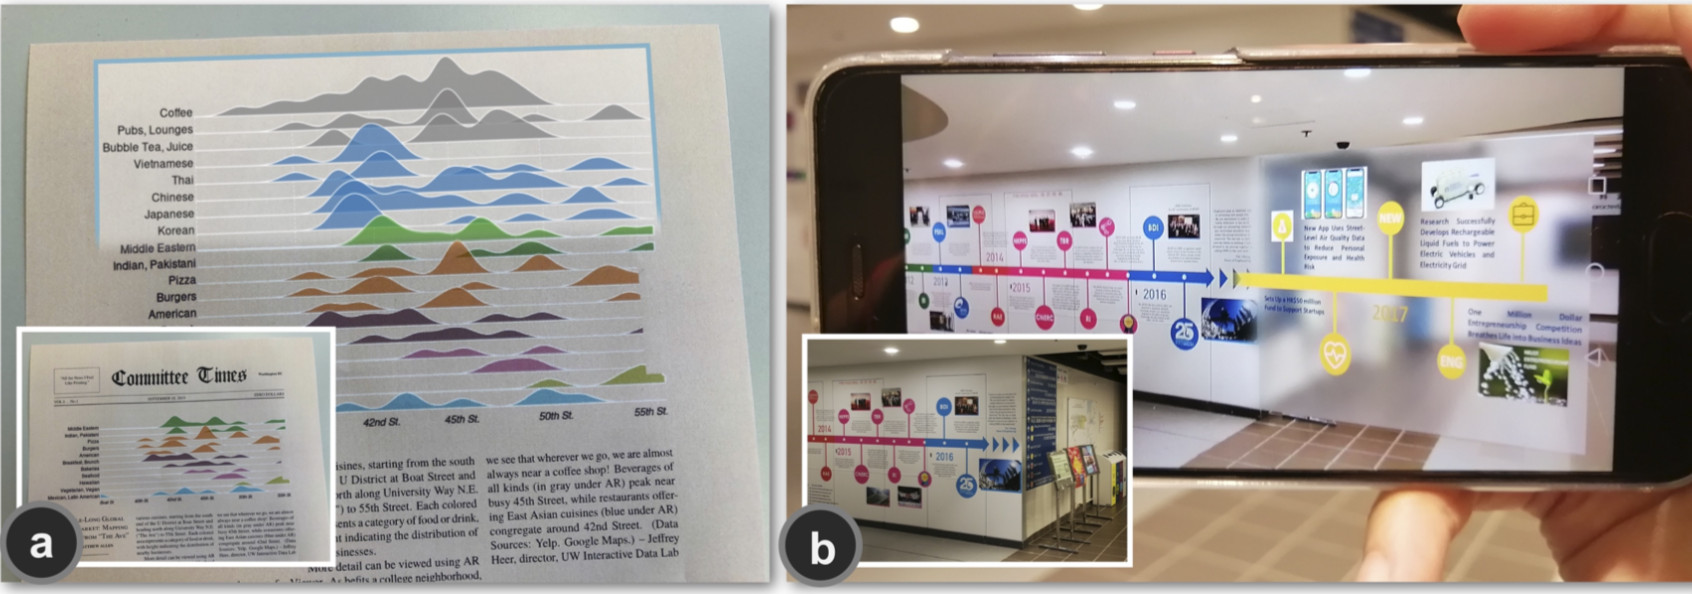
Augmenting Static Visualizations with PapARVis Designer: Zhutian Chen, Wai Tong, Qianwen Wang, Benjamin Bach, Huamin Qu. ACM Conference on Human Factors in Computing Systems (CHI). (2020).
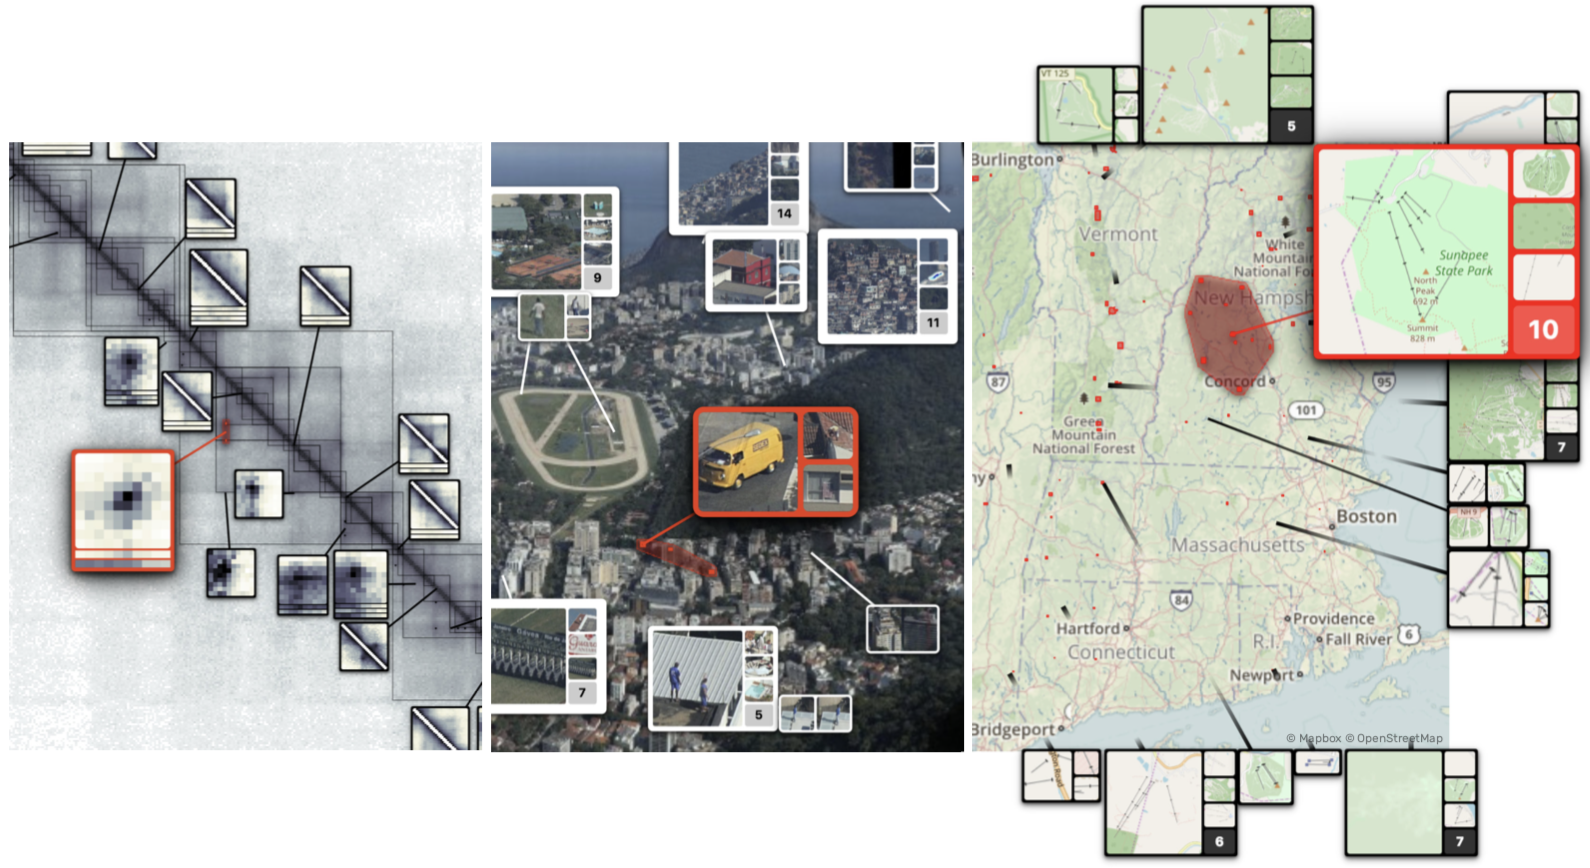
Pattern-Driven Navigation in 2D Multiscale Visualizations with Scalable Insets: Fritz Lekschas, Michael Behrisch, Benjamin Bach, Peter Kerpedjiev, Nils Gehlenborg, Hanspeter Pfister. IEEE Transactions on Visualization and Computer Graphics (TVCG) 2020 (IEEE VIS, 2019)). (2020).
IATK: An Immersive Analytics Toolkit: Maxime Cordeil, Andrew Cunningham, Benjamin Bach, Christophe Hurter, Bruce H. Thomas, Kim Mariott, Tim Dwyer. IEEE VR (2019). (2019). [WEB]
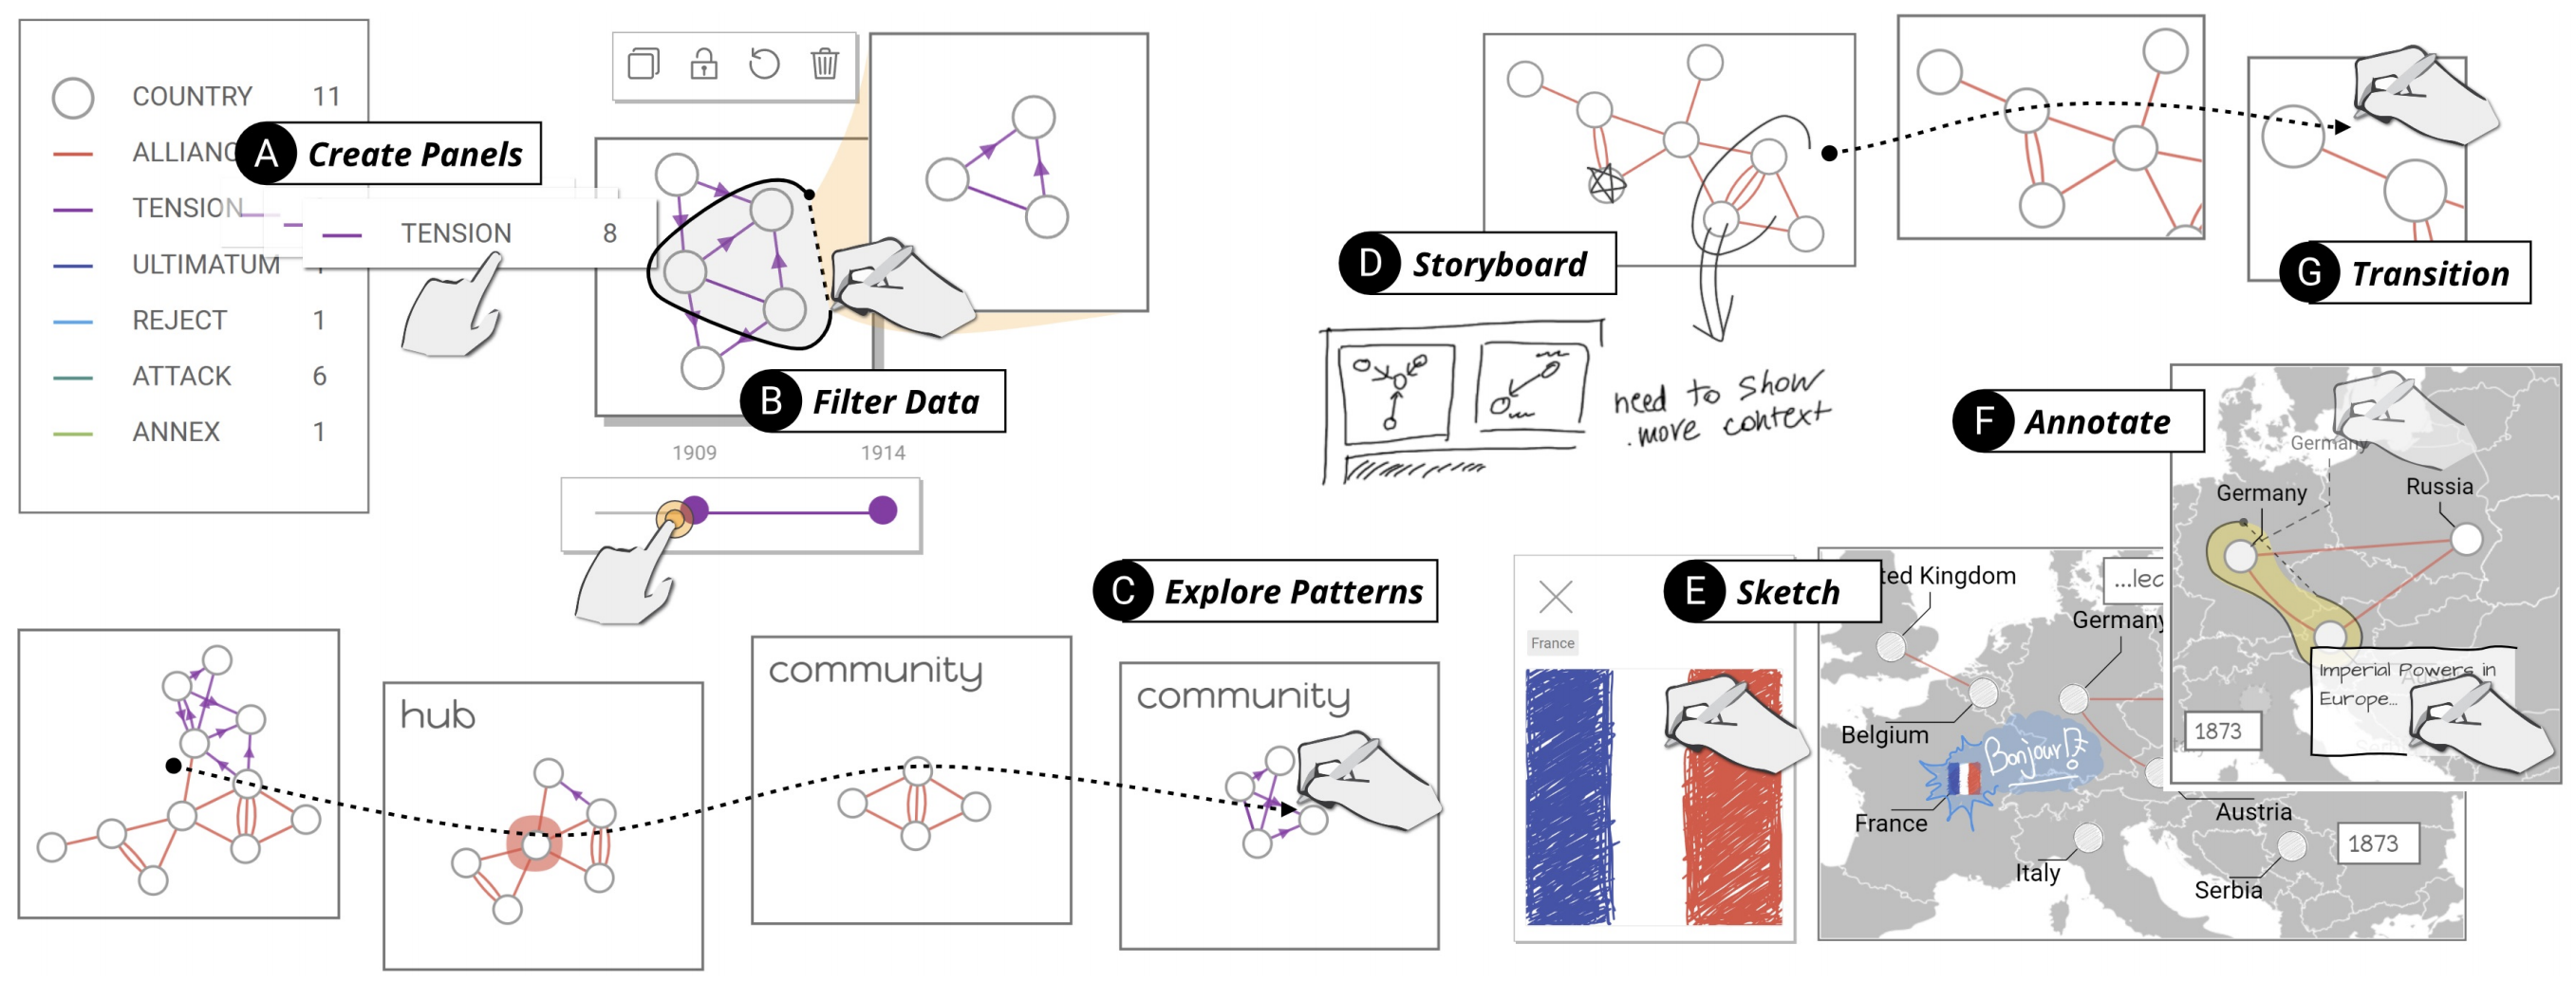
DataToon: Drawing Data Comics About Dynamic Networks with Pen + Touch Interaction: Nam Wook Kim, Nathalie Henry Riche, Benjamin Bach, Guanpeng Xu, Matthew Brehmer, Ken Hinckley, Michel Pahud, Haijun Xia, Michael J. McGuffin, Hanspeter Pfister. ACM Conference on Human Factors in Computing Systems (CHI). (2019).
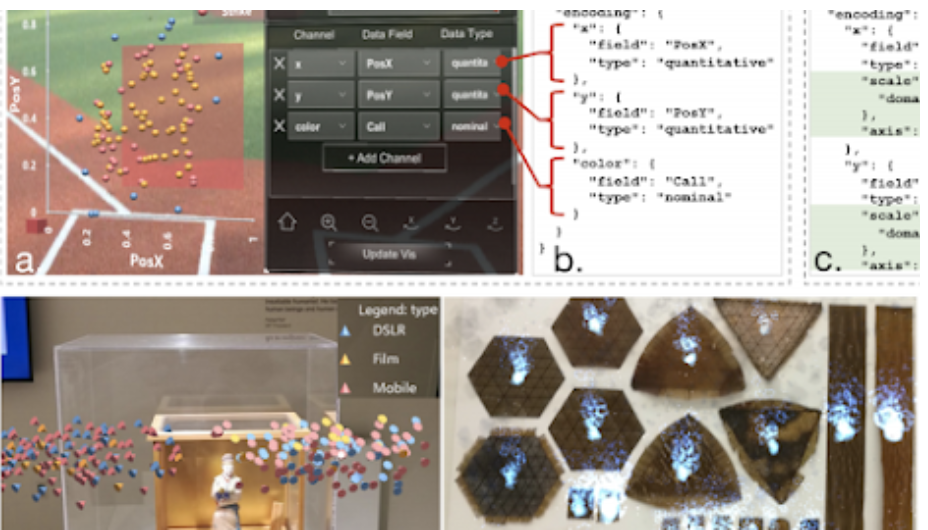
DXR: A Toolkit for Building Immersive Data Visualizations: Sicat, Ronell, Jiabao Li, JunYoung Choi, Maxime Cordeil, Won-Ki Jeong, Benjamin Bach, and Hanspeter Pfister. IEEE transactions on visualization and computer graphics (2019) (IEEE VIS 2018). (2019).
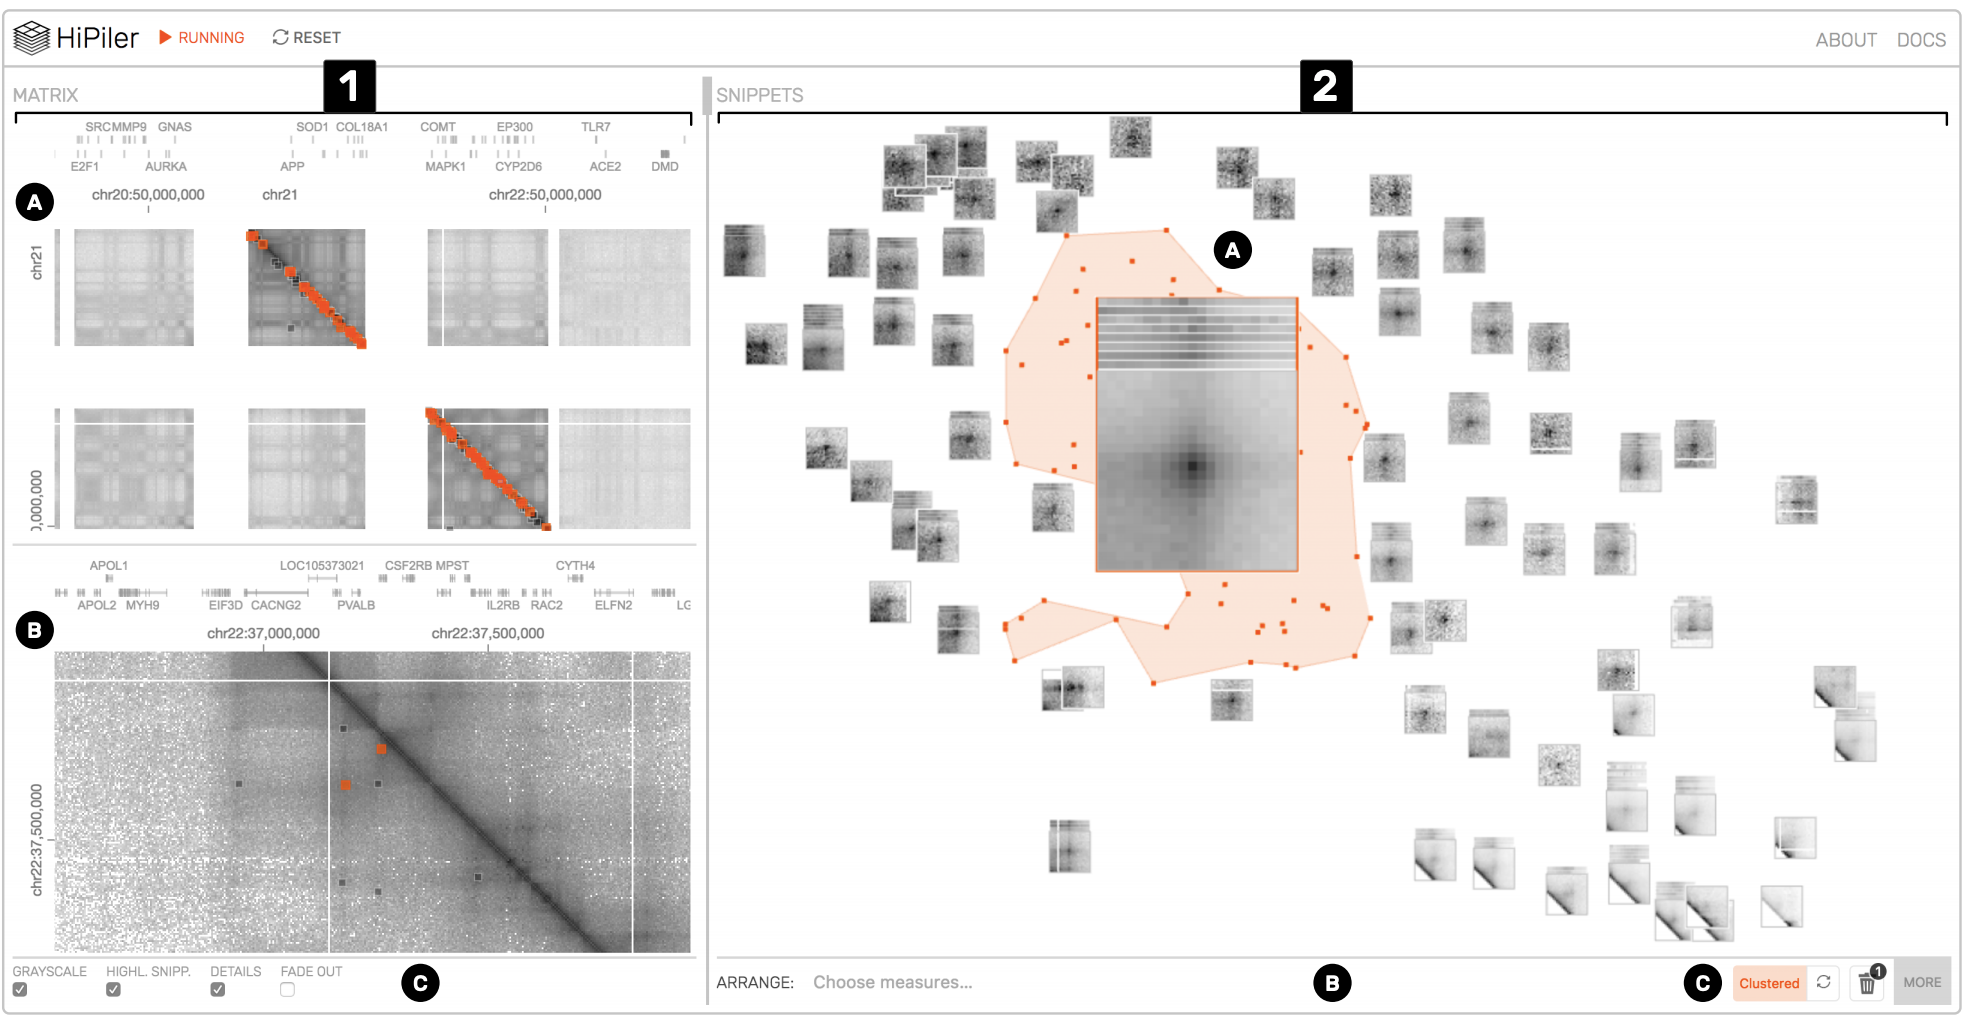
HiPiler: visual exploration of large genome interaction matrices with interactive small multiples: Lekschas, Fritz, Benjamin Bach, Peter Kerpedjiev, Nils Gehlenborg, and Hanspeter Pfister. IEEE transactions on visualization and computer graphics 24, no. 1 (2018): 522-531. (2018).
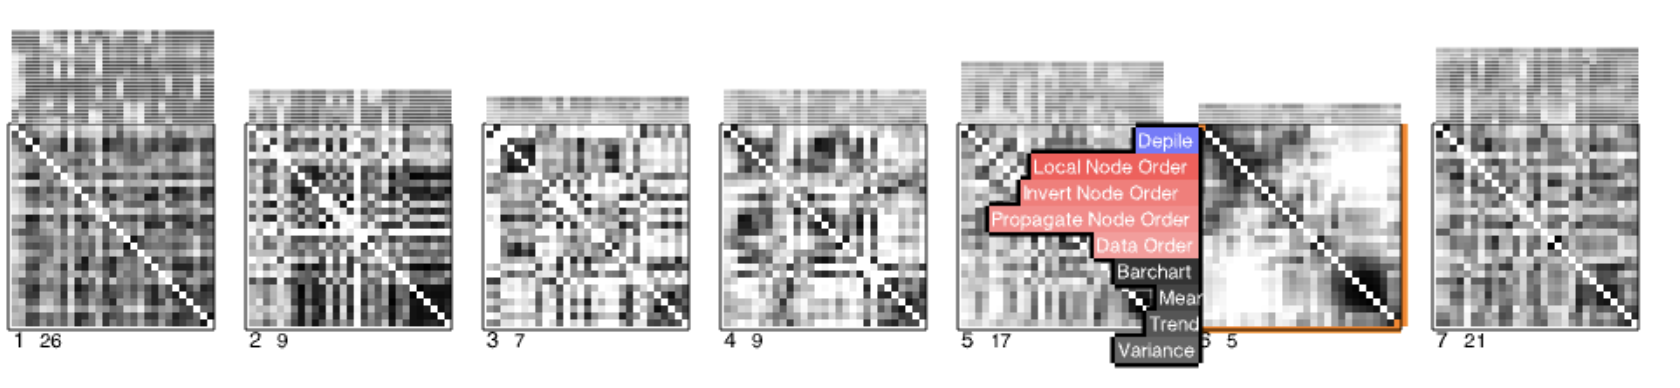
Small MultiPiles: Piling Time to Explore Temporal Patterns in Dynamic Networks: B Bach, N Henry Riche, T Dwyer, T Madhyastha, JD Fekete, T Grabowski. Eurographics Conference on Visualization (EuroVis). (2015). [WEB]
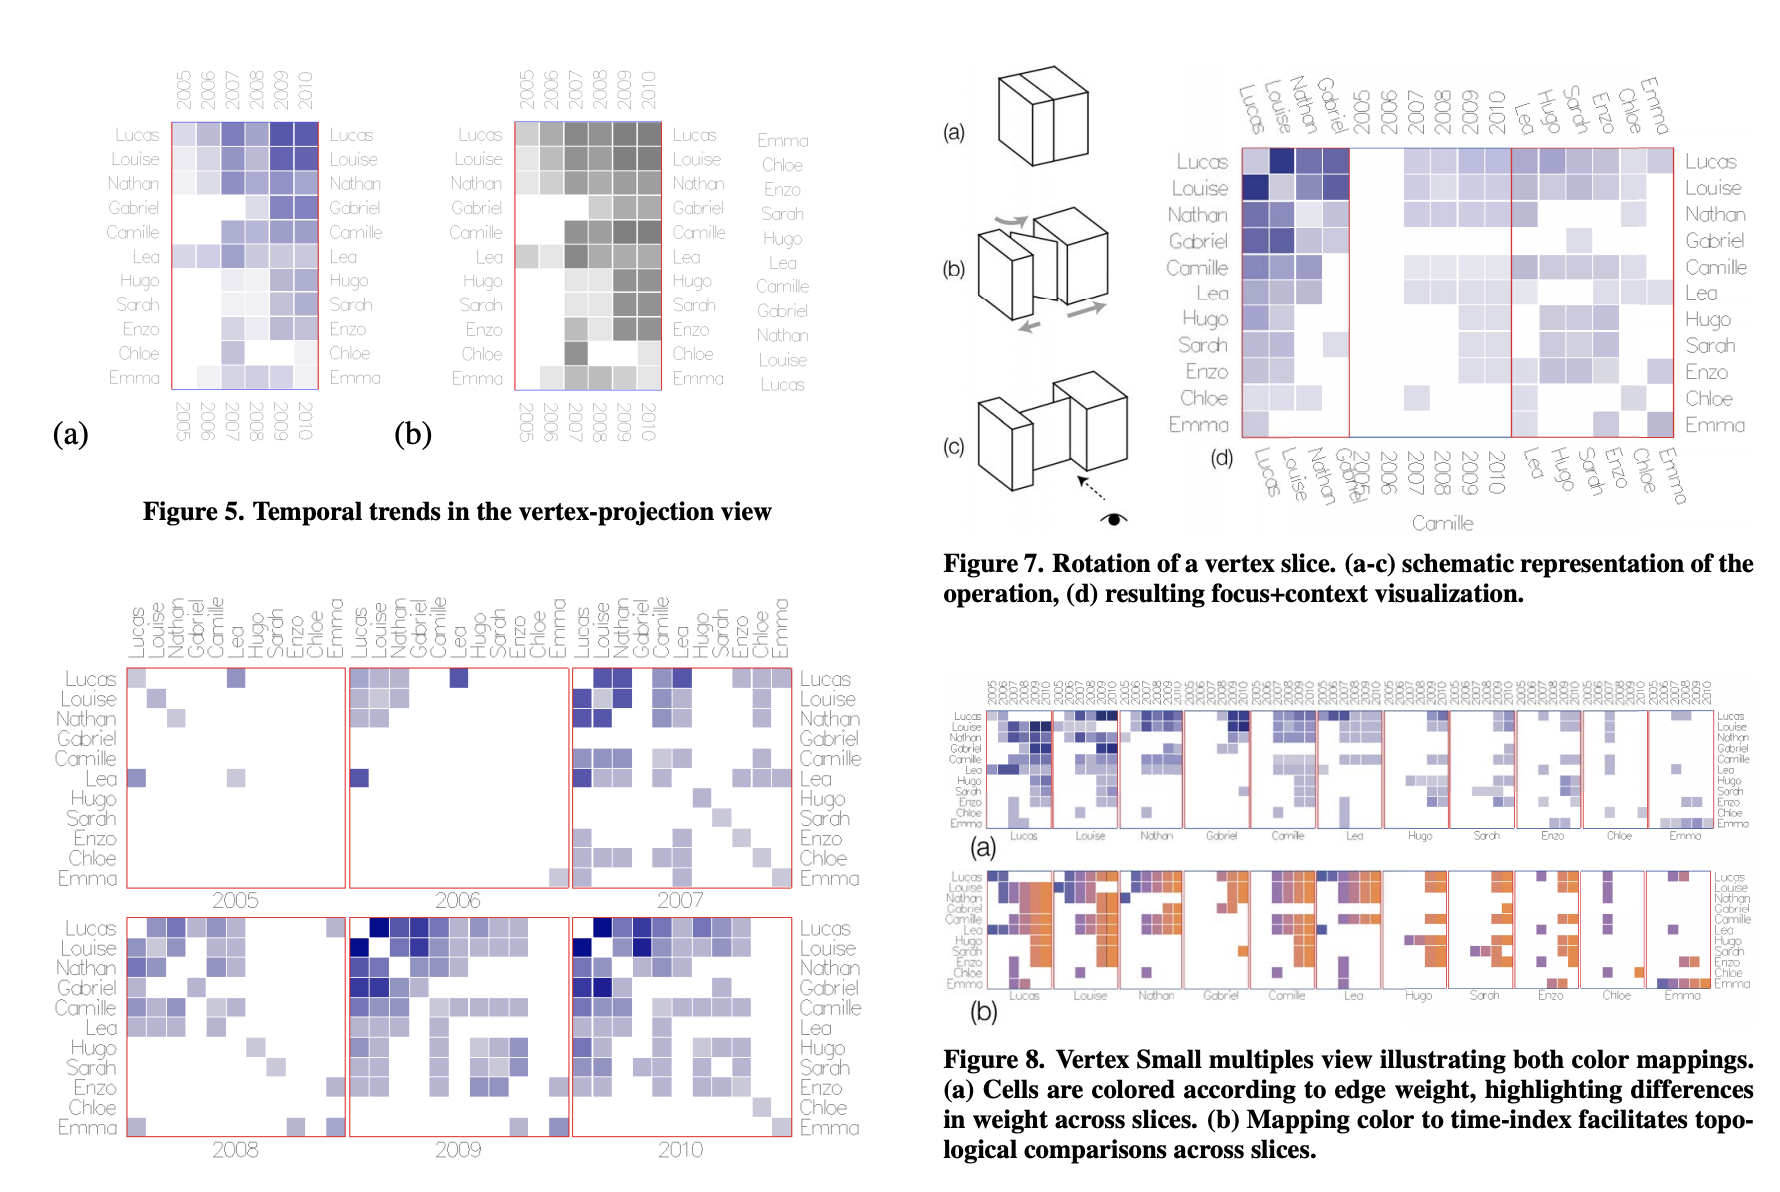
Visualizing Dynamic Networks with Matrix Cubes: Benjamin Bach, Emmauel Pietriga, Jean-Daniel Fekete. Proceedings of the SIGCHI Conference on Human Factors in Computing Systems (CHI). (2014).
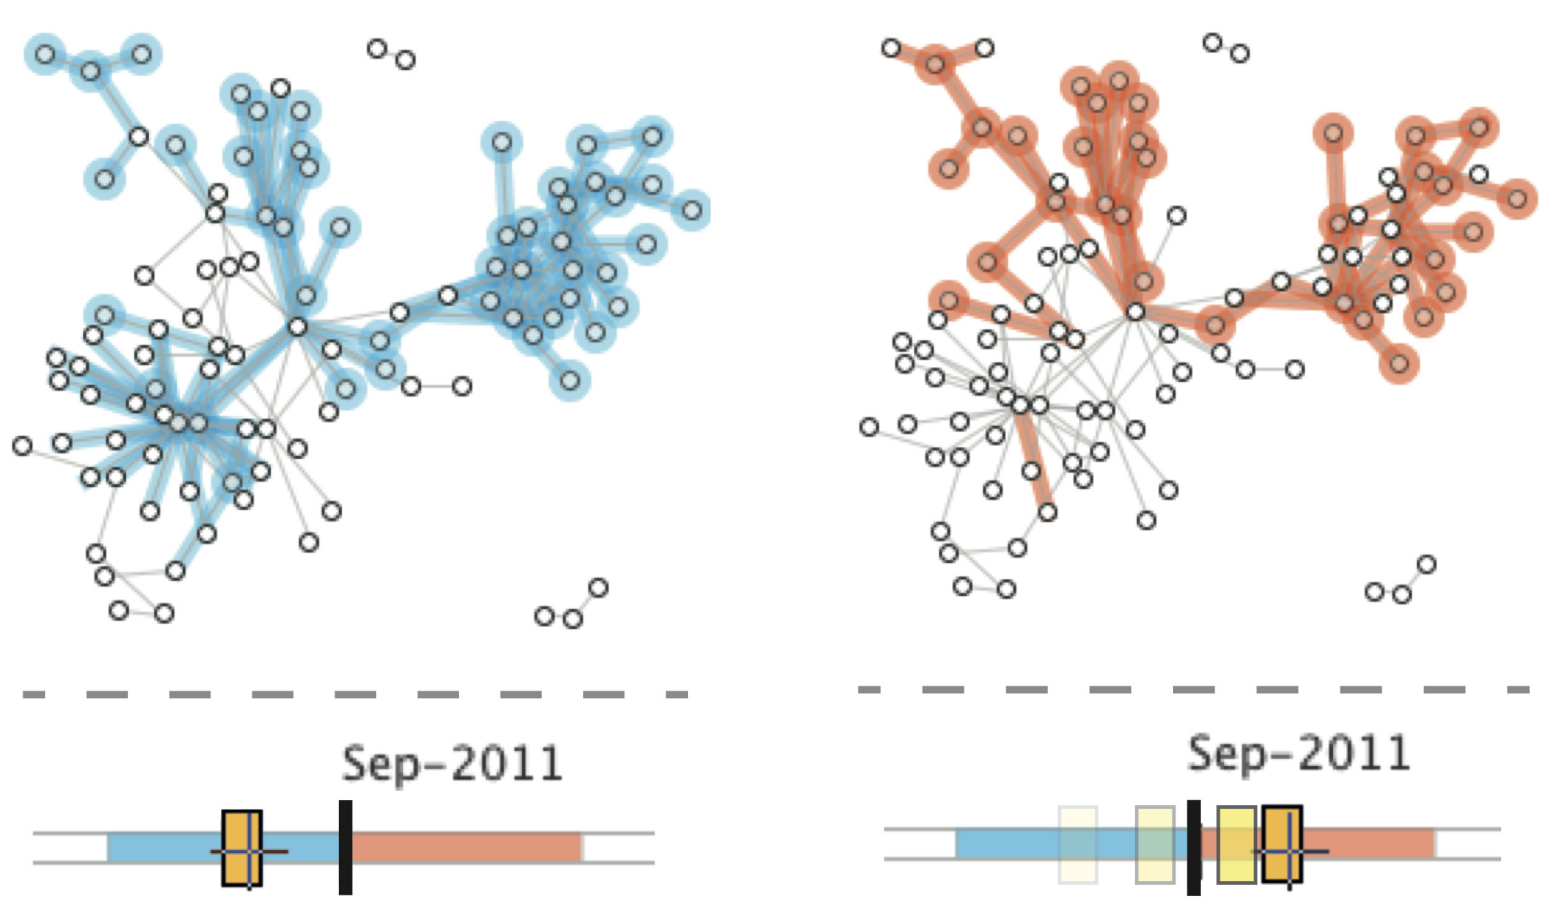
GraphDiaries: Animated Transitions and Temporal Navigation for Dynamic Networks: B Bach, E Pietriga, JD Fekete. Transactions on Visualization and Computer Graphics (TVCG), 1-1. (2014).