Interdisciplinary research lab in data visualization and HCI at the University of Edinburgh.
People - Jobs+PhD Projects
Equipment (kit) - Resources
Teaching - Outreach
Projects/Tools - Student Projects
https://vishub.net
Follow @vishublab


Projects/Tools
2023
Living Repository
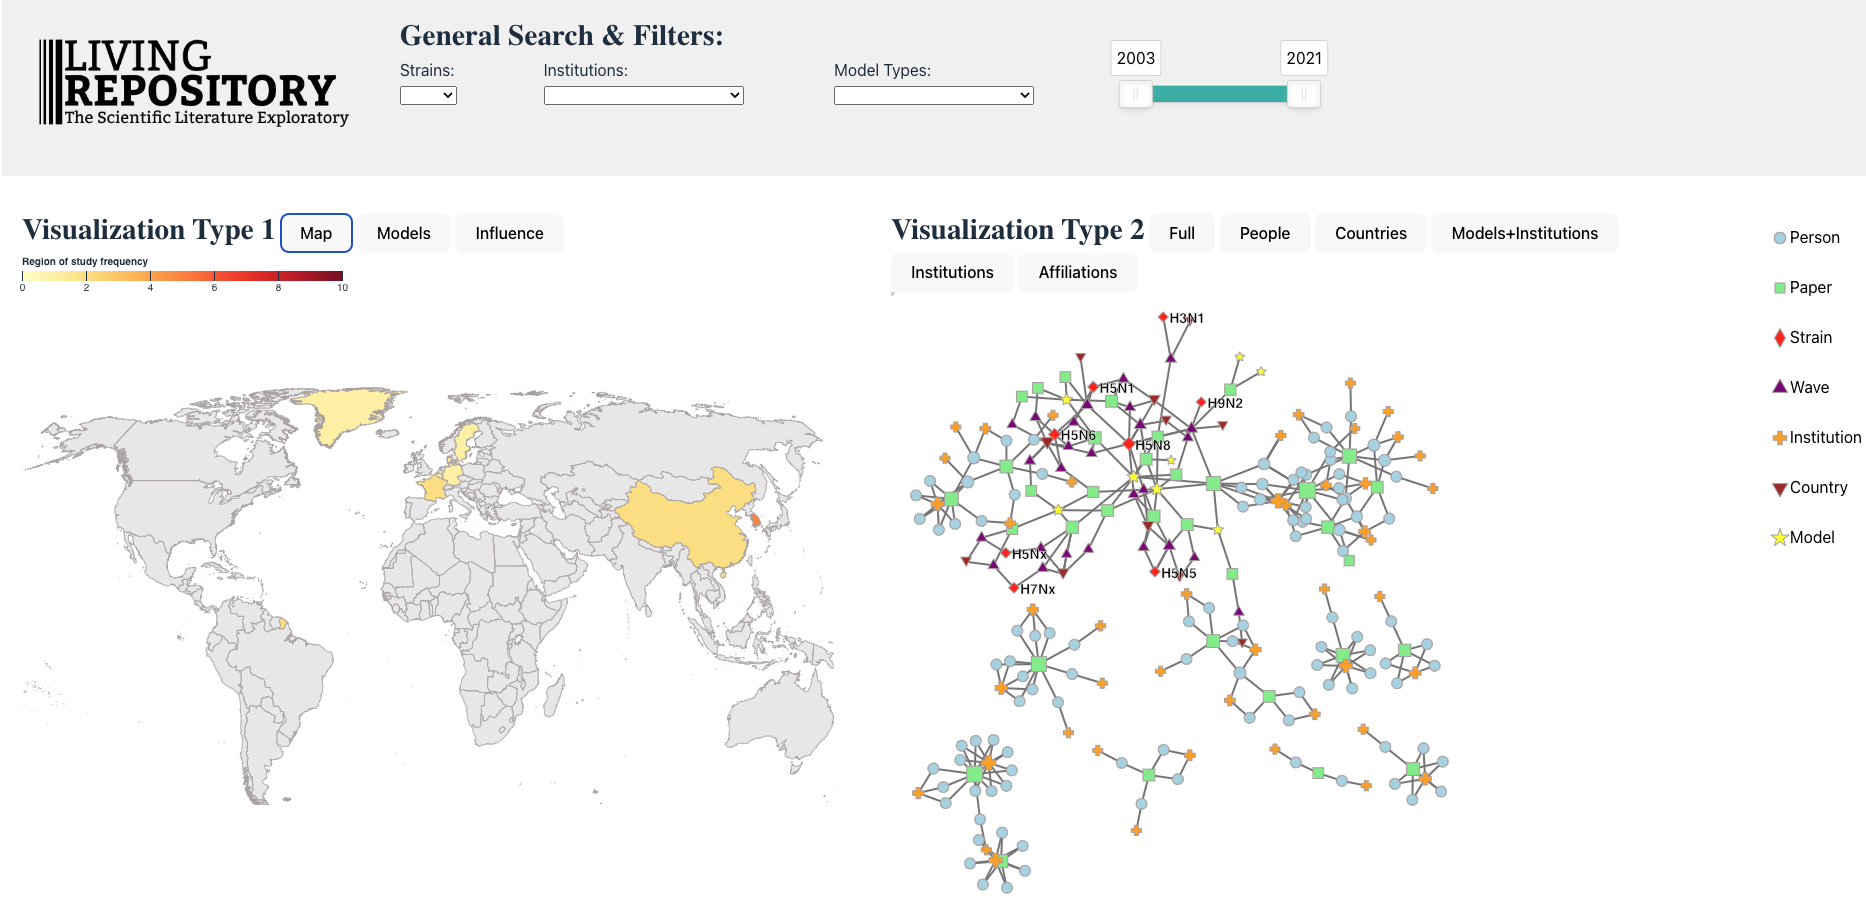
Alexis Pister, Chrysoula Lamprinopoulou, Benjamin Bach.
(2023).
Partners: EPIC Scotland
LivingRepository is a dashboard project designed to study the bibliography of biological papers studying different strains of Influenza. The interface have been designed in collaboration with a epidemiologist, and aims to answer where are the main areas of studies of Influenza, who are the main actors studying this disease, and what are the common methodologies used in the bibliography
2014
Vistorian
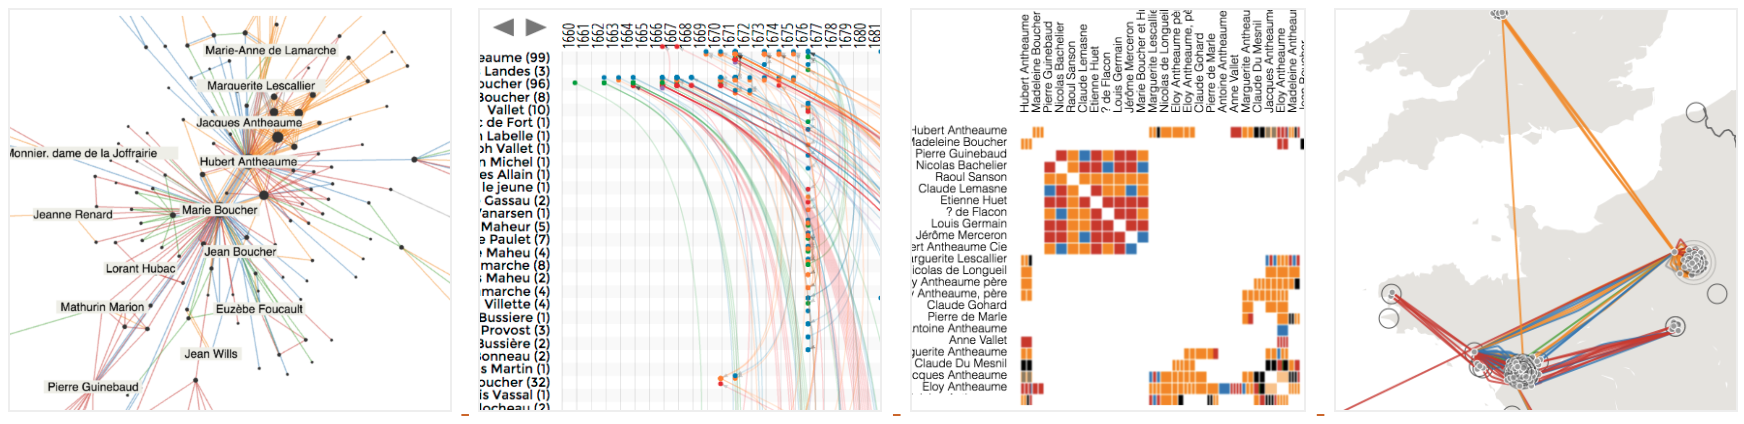
Benjamin Bach, Xinhuan Shu, Alexis Pister, Nathalie Henry Riche, Roland Fernandez, Emmanoulis Giannisakis, Bongshin Lee, Jean-Daniel Fekete.
(2014).
Partners: Inria, Microsoft
The Vistorian is an online tool for interactive exploration of dynamic, multivariate, and geographic networks. Main features include a wide range of different interactive network visualizations: node link diagrams, side-by-side views and parallel use of any of these visualizations. and a geocoding service that obtains geographic locations from placenames in your dataset.
Publications
Understanding the Use of The Vistorian: Complementing Logs with Context Mini-Questionnaires: Verena S. Molinero, Benjamin Bach, Catherine Plaisant, Nicole Dufournaud, Jean-Daniel Fekete. Workshop on Visualization for the Digital Humanities IEEE VIS. (2017).
GraphDiaries: Animated Transitions and Temporal Navigation for Dynamic Networks: B Bach, E Pietriga, JD Fekete. Transactions on Visualization and Computer Graphics (TVCG), 1-1. (2014).