Interdisciplinary research lab in data visualization and HCI at the University of Edinburgh.
People - Jobs+PhD Projects
Equipment (kit) - Resources
Teaching - Outreach
Projects/Tools - Student Projects
https://vishub.net
Follow @vishublab

Online Course Data Visualization for Professionals.
The VIShub is running a visualization course for working professionals. This is a 10-week long online course build around lectures, live tutorials, talks, Q&A sessions, individual check-in sessions with the course organizers, and project work. Each participant can join with their own data set and develop their own visualization project along the structured guidance and feedback along the 10 weeks. The course ends with a certificate.
For more details, see the course website.
The course allows us to better understand how visualizations is used and valued in application and which challenges and expectations people using visualization methods and tools see in their work and engagement with visualization.
People involved
- Benjamin Bach (Google Scholar)
- Aba-Sah Dadzie
- Uta Hinrichs (Google Scholar)
- Zehzong Wang
Publications
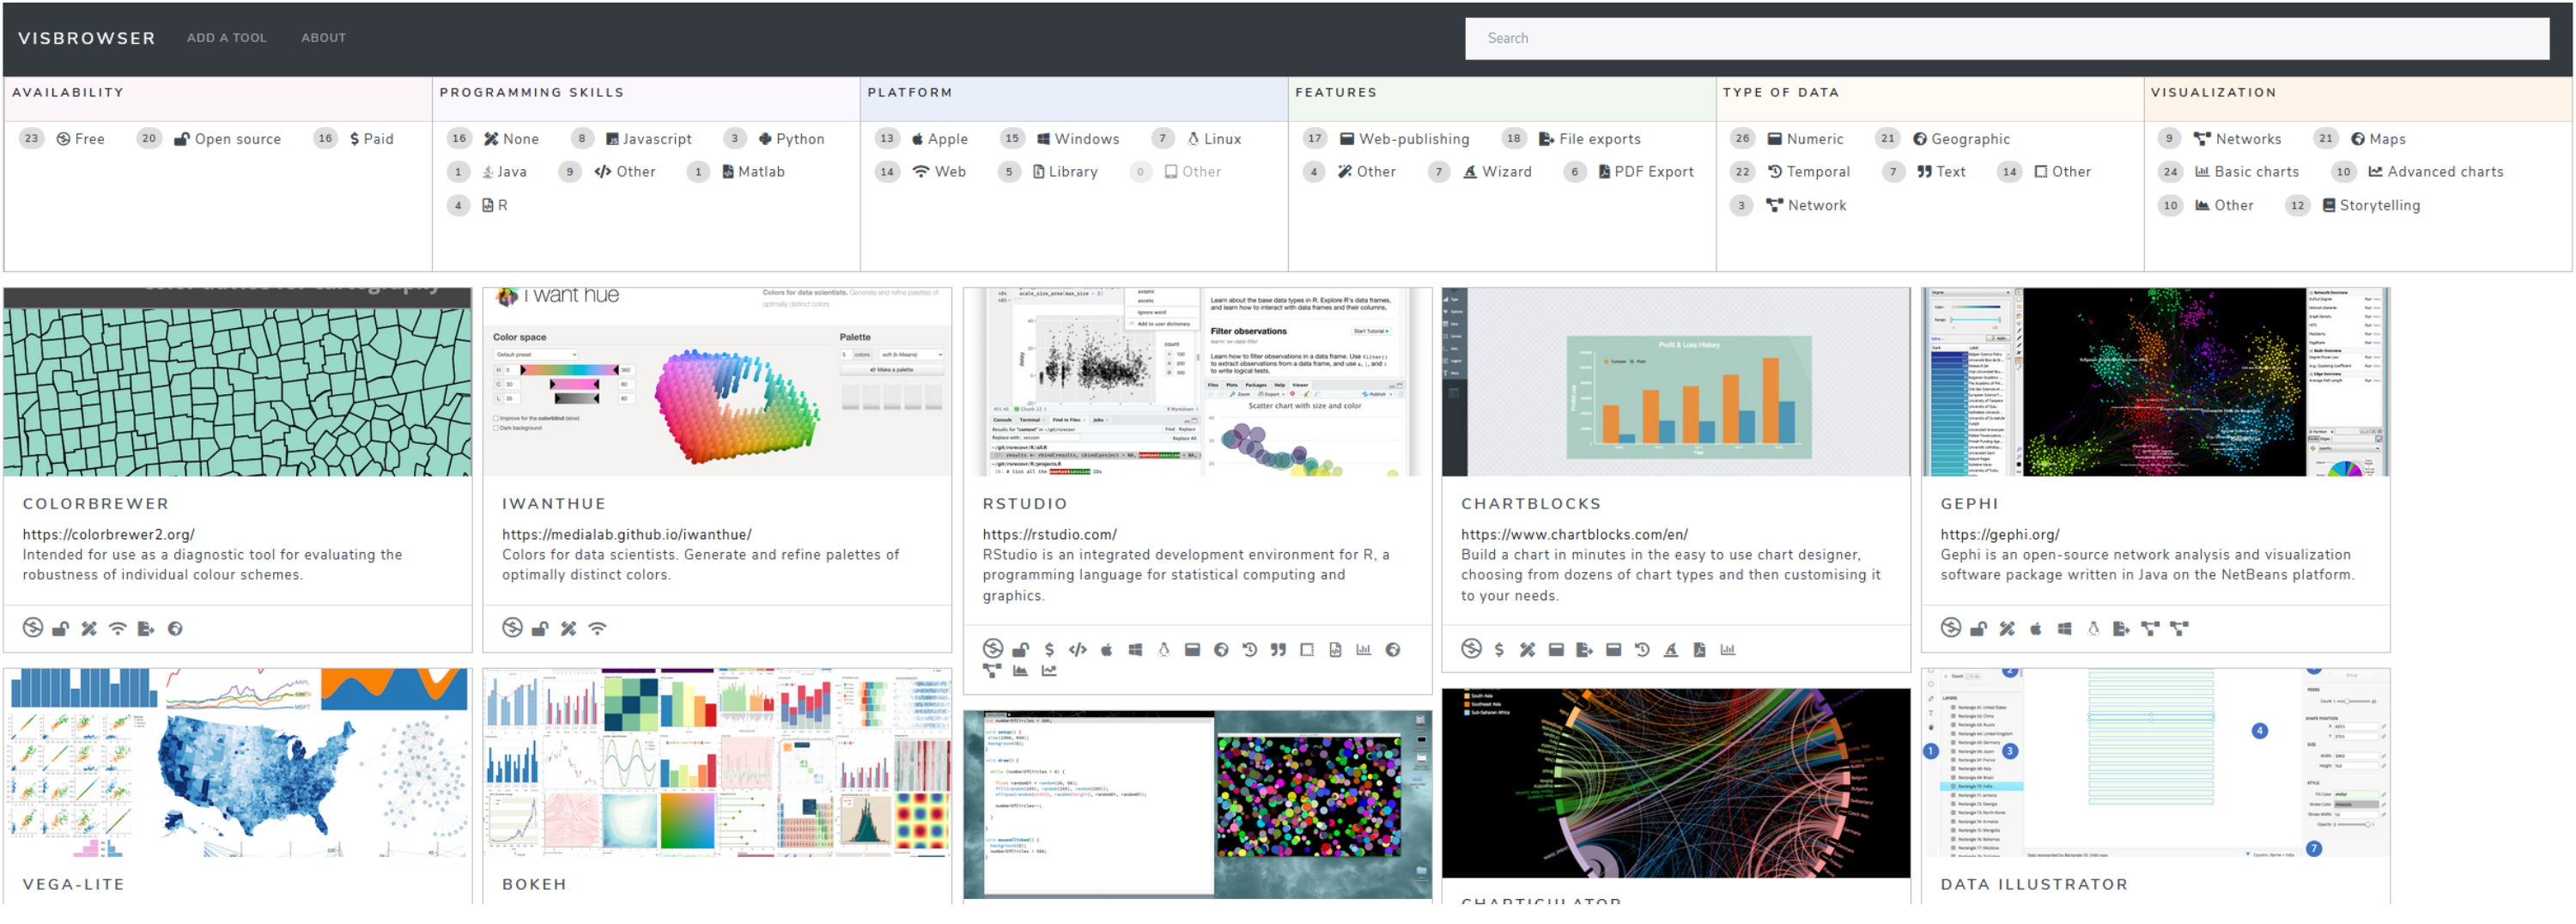
The VisTools Marketplace: An Activity to Understand the Landscape of Visualisation Tools: Arran Ridley, Sarah Schöttler, Aba-Sah Dadzie, Benjamin Bach. Workshop on Vis Activities @ IEEE VIS conference. (2020). [WEB]
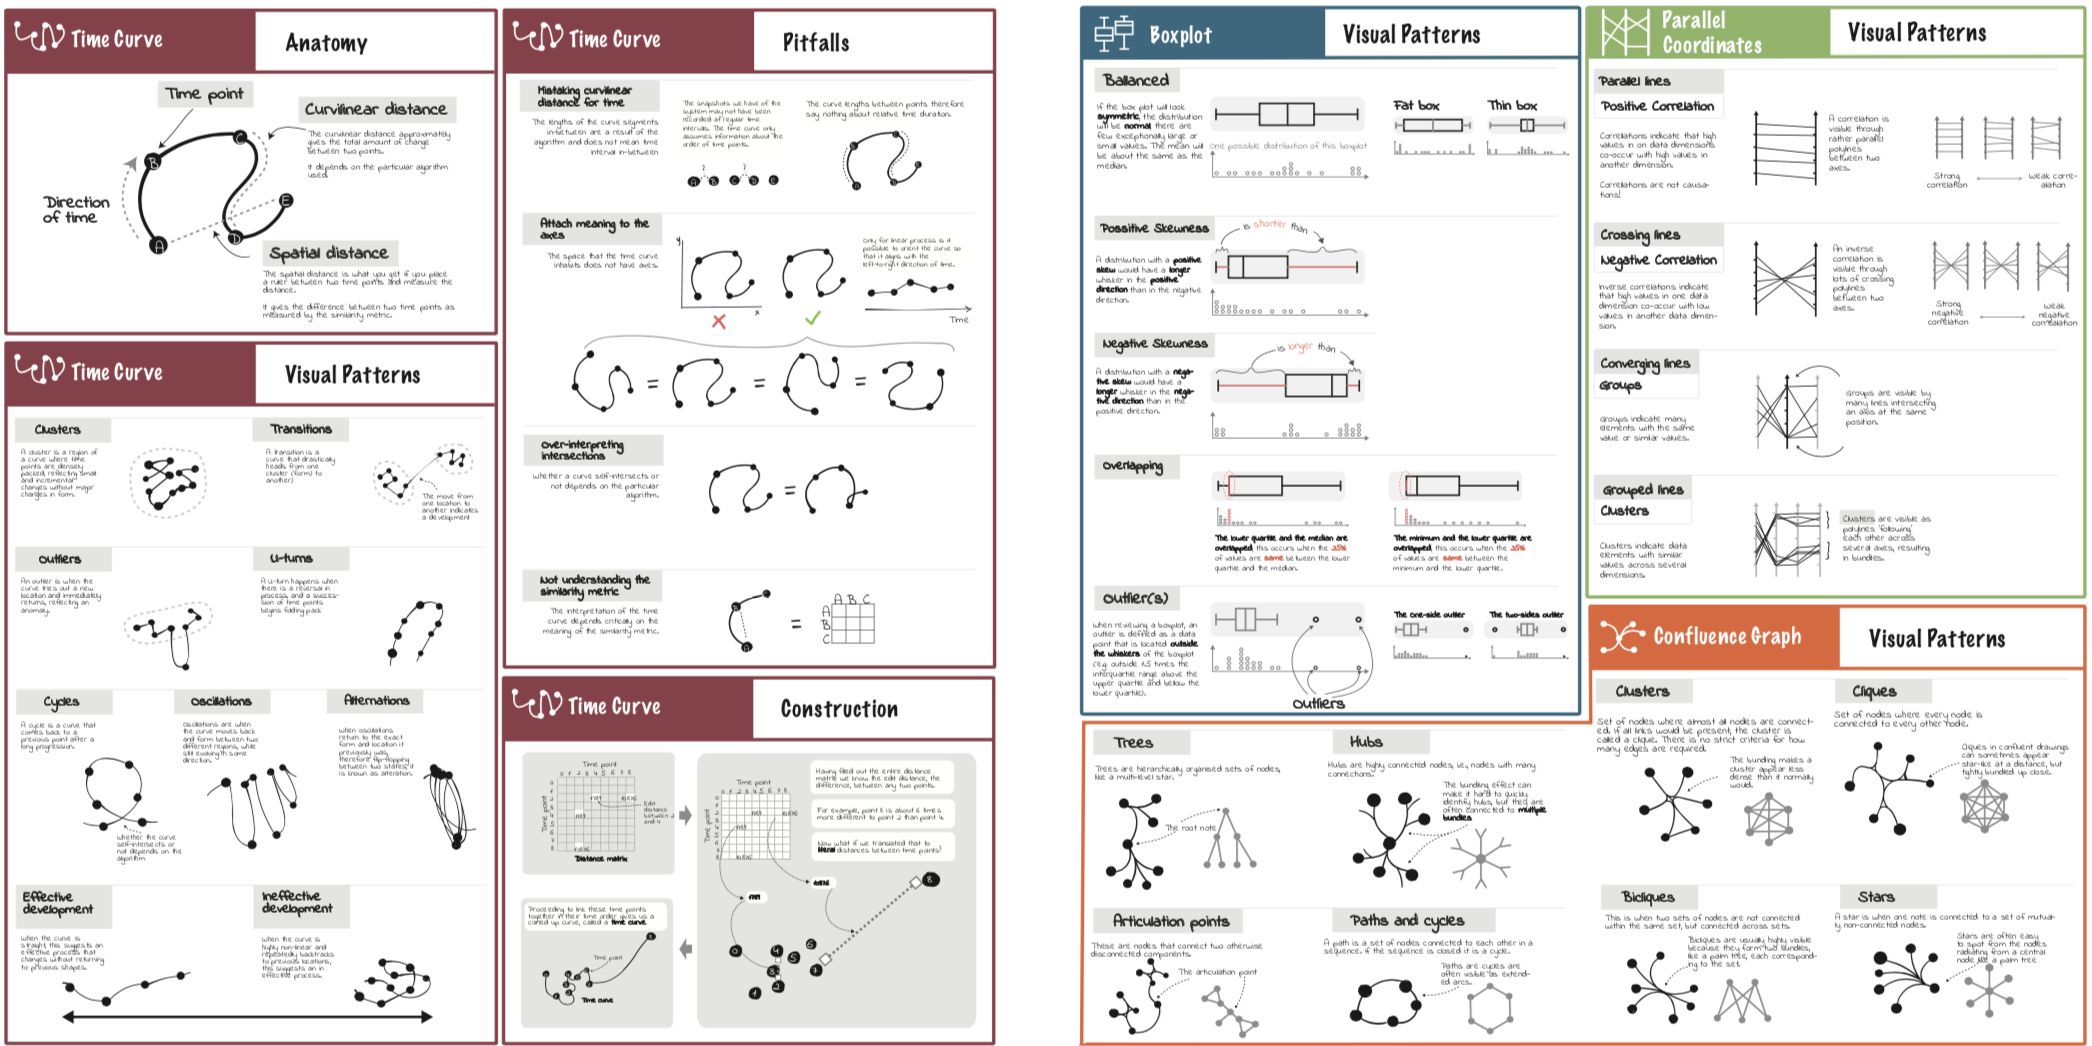
Cheat Sheets for Data Visualization Techniques: Zezhong Wang, Lovisa Sundin, Dave Murray-Rust, Benjamin Bach. ACM Conference on Human Factors in Computing Systems (CHI). (2020). [VIDEO]
Teaching Data Visualization and Storytelling with Data Comic Workshops: Zezhong Wang, Harvey Dingwal, Benjamin Bach. ACM Conference on Human Factors in Computing Systems (CHI), Extended Abstracts. (2019).